For our article Valiant PremiAIR 4 Heat Powered Stove Fan Testing we set up an array of digital temperature sensors for a datalogger using a WiFi connected Raspberry Pi Model A+. In this article we will have a quick look at how we set this up so that we could reliably collect accurate temperature data, and view it in real time via a mobile phone or tablet.

The Valiant PremiAIR 4 is a heat powered stove fan. This type of device uses the difference in temperature between its base (which is in contact with the top of the hot stove) and a large heatsink at the top which dissipates heat well. This temperature differential generates electricity via the Seebeck Effect which powers a small motor which turns a fan which should drive hot air from the stove directly at the people in a room instead of allowing it rise straight up to the ceiling. By putting the heat where it is needed, such fans can reduce the amount of fuel used to keep people comfortably warm.
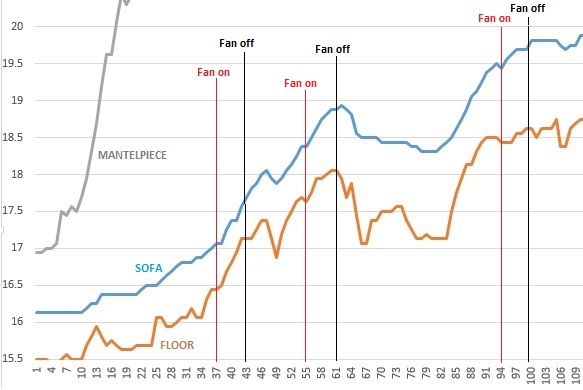
Our experiments were designed to track the temperature of multiple sensors for realtime monitoring and logging for later analysis. One sensor was positioned above the mantelpiece to detect the heat rising above the stove, one near to floor level a couple of metres away from the front of the stove, and most importantly one at chest/head height on the sofa. The experiment was designed to see what happens when the fan is on and then what happens when it is removed to see how effective this heat powered stove fan is.
Spark Core Photon Datalogger
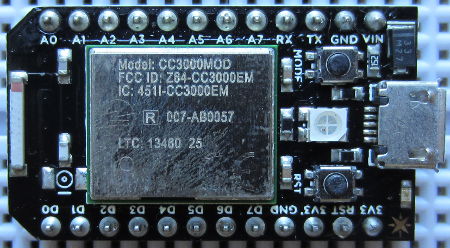
Initially we intended for simplicity to use a Spark Core – Photon – a very small open source WiFi enabled Internet of Things (IoT) hardware development kit. This can be programmed with Arduino code (Wiring), an SD card reader can be added for datalogging, and the temperature sensor readings can be monitored online. All interactions with the Photon are via a web interface, and for anyone experienced in using Arduino, it is very easy to get started.

We finished all the code to read the temperature of the three (ds18b20) digital sensors, and created a simple PHP web page to automatically grab those readings from the cloud and present them in an easy to view manner on any web browser. We decided against adding the SD card reader since the PHP web page could also be used to append each new set of readings to a simple text file stored on the server hosting the web page, building up a datalog over time which could then be downloaded and analysed after running the experiment.
However, we had repeated problems with the Spark Core Photon losing its WiFi connection and not reconnecting without cycling the power on/off multiple times. Often we would have to reset the device 10 or more times before it would reconnect. Moving the Photon to alternative locations to maximise the WiFi connection strength did not help (the whole room has excellent WiFi strength and no other devices have had any problems connecting).
We had similar problems getting our code from the easy to use and otherwise excellent Spark Core web based IDE to our board which made the development process very slow, frustrating, and impractical. We therefore decided to change approach and instead go for a Raspberry Pi based solution. We could have carried on with the Spark Core device, but having WiFi drop out during multi-hour experiments, was too big of a risk.
Raspberry Pi Datalogger

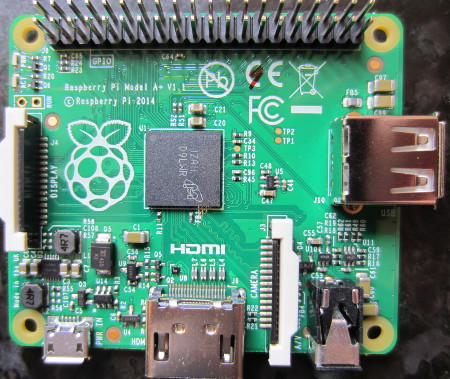
When we were setting up and testing our Spare Core datalogging solution, the Raspberry Pi Model A+ had just been released so we decided to use one of those coupled with a WiPi wireless dongle for wireless network connectivity. Initially we had a few problems again with WiFi dropping out after short power outages and resetting the router, and since we were running the Pi headless (no monitor and no keyboard) this was obviously very inconvenient. However, this simple resource: Rebooting the Raspberry Pi when it Loses Wireless Connection resolved that issue.

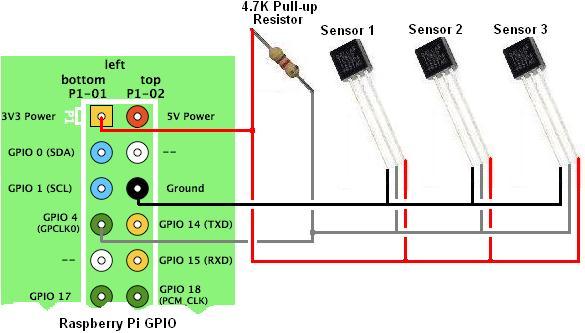
We followed the steps detailed in our articles DS18B20 Temperature Sensor with Raspberry Pi and Connect Multiple Temperature Sensors with Raspberry Pi to hook up three ds18b20 temperature sensors to our Raspberry Pi. With the hardware all in place, we then just had to write some software to grab the readings from the temperature sensors and log them, and also to serve them so that results could be viewed on the local network.
We chose to use PHP for this datalogger, but any other programming language with which you are comfortable could have been used including BASH scripting or Python.
First of all the Raspberry Pi was set up with an Apache webserver and PHP with the following command:
sudo apt-get install apache2 php5 libapache2-mod-php5
Then, with the installation completed, this command to restart the server:
sudo service apache2 restart
Typing in the IP address of the Raspberry Pi on a web browser on the same network brings up the standard Apache It works! This is the default web page for this server… etc message which shows the web server is working as it should.
To keep things simple and reliable, we chose to write a short PHP script which would grab the three temperature sensor readings and append them to a simple text file, and then to call that script once every minute using cron – a time based job scheduler found on all Linux based operating systems (including the Raspberry Pi). Therefore, if the PHP script had an undetected bug in it – e.g. it crashed when a sensor could not be read, or if WiFi dropped out and the Pi reset – datalogging would start again automatically the next minute without any manual intervention.
Here is the PHP script we wrote and saved as monitor.php in /var/www to append data to a file templog.txt. Note that the addresses (in green below) are specific to the sensors we used, and if you were to replicate this experiment you would need to follow the instructions here: DS18B20 Temperature Sensor with Raspberry Pi to obtain the addresses for your sensors. (This script could be run via a web browser by entering the URL http://192.168.1.97/monitor.php where 192.168.1.97 was the IP address of the Raspberry Pi on our local network.)
monitor.php
<?php
define("SENSOR_PATH", "/sys/bus/w1/devices/28-00141294bdff/w1_slave");
define("SENSOR2_PATH", "/sys/bus/w1/devices/28-001414b8f1ff/w1_slave");
define("SENSOR3_PATH", "/sys/bus/w1/devices/28-001413ac5fff/w1_slave");

$thermometer = fopen(SENSOR_PATH, "r");
$thermometerReadings = fread($thermometer, filesize(SENSOR_PATH));
fclose($thermometer);
$thermometer2 = fopen(SENSOR2_PATH, "r");
$thermometerReadings2 = fread($thermometer2, filesize(SENSOR2_PATH));
fclose($thermometer2);
$thermometer3 = fopen(SENSOR3_PATH, "r");
$thermometerReadings3 = fread($thermometer3, filesize(SENSOR3_PATH));
fclose($thermometer3);

preg_match("/t=(.+)/", preg_split("/\n/", $thermometerReadings)[1], $matches);
$temperature = $matches[1] / 1000;
preg_match("/t=(.+)/", preg_split("/\n/", $thermometerReadings2)[1], $matches);
$temperature2 = $matches[1] / 1000;
preg_match("/t=(.+)/", preg_split("/\n/", $thermometerReadings3)[1], $matches);
$temperature3 = $matches[1] / 1000;

//first time and date, then datalog data
$s = date('H:i:s j F Y') . ", ";
$s .= number_format($temperature,2) . ", ";
$s .= number_format($temperature2,2) . ", ";
$s .= number_format($temperature3,2);
$s .= "\n";
file_put_contents("/var/www/templog.txt", $s, FILE_APPEND);
?>
In order to get our monitor.php script to run automatically at regular intervals we appended the following to the crontab (configuration file) after entering the command: crontab -e.
* * * * * /usr/bin/php /var/www/monitor.php
This will run the PHP script monitor.php located in the /var/www/ directory (where PHP has been installed at /usr/bin/php) once every minute.
We then wrote another script recent.php to enable us to quickly view the twenty most recent temperature readings for all sensors through a web browser (most recent first):
recent.php
<?php
$status = array();
//make a summary with last 20 minutes of readings.
print "<b>Last 20 Minutes</b><br>";
print "Time and Date, Sofa, Floor, Mantlepiece<br>";
exec ("cat /var/www/templog.txt | tail -20 | tac", $status);
for($i = 0; $i < count($status); $i++)
  print $status[$i] . "<br>";
?>
Entering http://192.168.1.97/recent.php in the address bar of a web browser runs this script and the recent temperature readings are displayed. Then after the experiment had been run we plotted the collected data using Excel.

All in all this was an effective if rough and ready method of building a reliable temperature data logger. There are of course many possible enhancements. If we had planned to leave this datalogger running indefinitely for example instead of as a one off experiment, we would have used Google Charts to automatically plot some nice graphs (viewable in a web browser) of the most recent temperature readings for quicker viewing and immediate visualisation of the results.