Rainwater Toilet Flush Pump Controllers with LCD

We have been making a bespoke range of controllers for people who would like to use rainwater for their toilet flushes for around 6-7 years now. Here is an example of one of our early Rainwater Toilet Flush System Controllers with details of how such a system works.
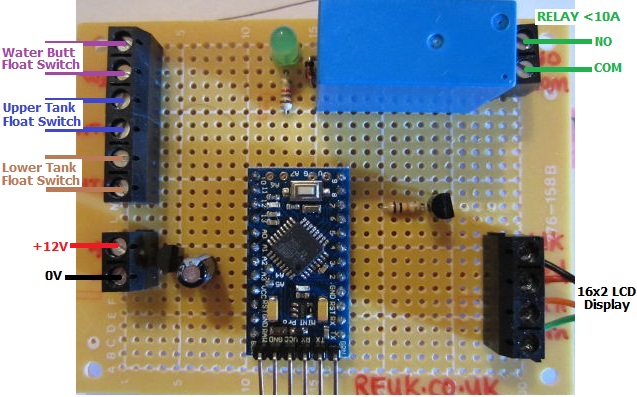
rainwater pump controller with LCD display and empty water butt sleep functionPictured above is one of our more advanced systems which includes an LCD display to keep the user up to date with the status of the system and water levels in the water butt and header tank (which gravity feeds to the toilet cisterns in the home).

In this particular case, if the two float switches in the header tank are not in water, the tank is empty, and so the pump turns on to fill the tank. If there is sufficient water in the water butt to fill the tank, then the pump will stop when the tank is detected to be full. If however the water butt is empty (or becomes empty during pumping), then then controller sleeps for four hours to allow a rain shower to collect a good amount of rainwater (if it rains in the meantime) so that pumping later will fill the tank.

rainwater controller system normal LCD displayThe display constantly shows the status of the water butt (WB) – either OK or LOW (empty), and the status of the header tank (HT) – either EMPTY, OK, or FULL. The bottom line of the display shows whether the pump is running, the controller is sleeping, or everything is just ticking along as it should.
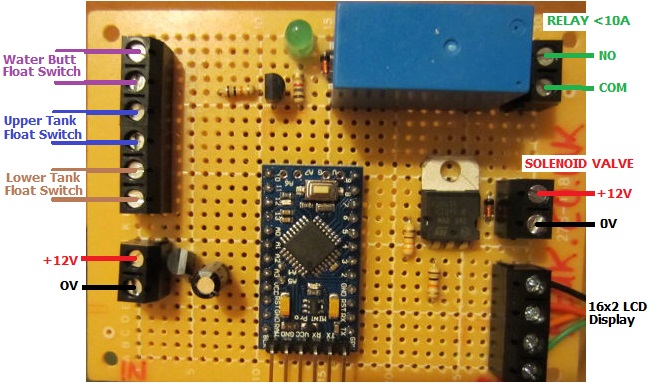
rainwater pump controller with mains water solenoid and LCD displayThe controller pictured above is a little more advanced. If the header tank is detected to be empty, then the pump will start as normal unless the water butt is also empty. If during pumping, the water butt becomes empty (or if it is already empty when the header tank is detected to be empty), a solenoid valve will close which will allow the flow of water up the rising main to enter the header tank to ensure that the toilets can always be flushed without any manual intervention.

rainwater controller with solenoid valve activatedThe display for this particular controller also shows the user when the solenoid valve is open so they know that you are using mains water due to a lack of stored rainwater in the water butt. There is no need for a four hour delay with this unit since every time the header tank empties and the water butt is either empty or becomes empty during pumping, the mains water supply will top up the header tank.

This controller is based around an Arduino Pro Mini microcontroller development board and uses standard horizontal float switches in the water butt and header tank to detect water levels.

If you need a rainwater toilet pump controller of any type, please email neil@reuk.co.uk with details of your specific requirements.
Pyboard Python for Microcontrollers

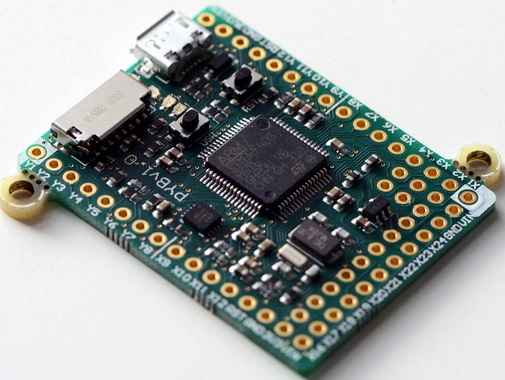
Pyboard python for microcontrollersPictured above is the Pyboard – an open source prototyping platform designed and manufactured in the UK. This board with its ARM microcontroller (STM32F405 clocked at 168MHz) is programmed using micropython a low memory usage version of the Python 3 scripting language.

The board has LEDs, microswitches, a built in accelerometer, and 30 general purpose IO connections (including 4 PWM, 14 ADC, I2C, and SPI pins) for connection to external components and analogue/digital sensors for your projects.

The board has 1MB of on board flash memory, 192KB of RAM, and also a micro SD card slot which can be used to store scripts and hold project generated data. It has a built in USB interface.

Pyboard fits in the marketplace somewhere between Raspberry Pi and Arduino. A Raspberry Pi is a full computer which means that it can be complicated to use, power hungry, and large in size. An Arduino is simple to use, has lots of useful GPIO and shields, and they are available in small versions, but they are not very fast and scripts need to be compiled on a PC before loading them to the Arduino. Pyboard is perfect for processor intensive stand alone projects – particularly for anyone who already has experience programming with Python.

Pyboard is just 33 x 40mm in size and weighs just 6g.

The official Micro Python website is here, and the tutorial which shows how to get strarted with Pyboard and Micro Python is here: Micro Python Tutorial.

New REUK Low Voltage Disconnect with Display

Pictured below is the new REUK Programmable 12V Low Voltage Disconnect with LCD Display. This device allows batteries and battery banks to be protected from being too deeply discharged, and also enables battery  monitoring.

reuk low voltage disconnect with displayFor full details, instructions for use, and to purchase, click here: REUK 12V LVD with LCD). It has been added to the existing low voltage disconnect circuits in the REUK Shop.

Valiant PremiAIR 4 Stove Fan

In our article Valiant Heat Powered Stove Fan published back in 2012 we reviewed the FIR300 Self-Powered Stove Fan from Valiant and showed how this device can help increase the temperature in the room being heated by a logburner or multifuel stove.

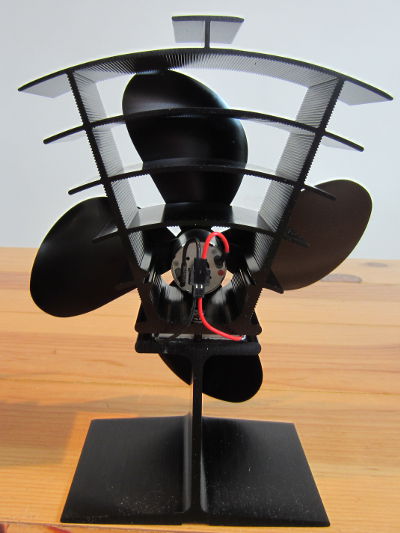
Comparison of Fir300 and Fir361 stove fans from ValiantThe reviewed FIR300 stove fan is pictured above on the left next to the new PremiAIR 4″ Stove Fan (FIR361) also from Valiant which we will soon be reviewing in detail.

The immediately obvious differences are the four blades instead of two which should increase the air flow, a new motor, and a more compact design with the motor housed within the heatsink rather than protruding out from it.

The heatsink on the new PremiAIR 4″ has a larger surface area with a new design for faster heat dissipation. Therefore more power should be available to the motor by the seebeck effect increasing the effectiveness of the stove fan.

Rear view of Fir361 PremiAIR 4 inch stove fan from ValiantWhen reviewing the FIR300 stove fan, we used an accurate digital thermometer and manually logged the temperature in the room minute by minute. For our FIR361 review we will put together a multi-sensor datalogger using a Raspberry Pi and/or Arduino to collect much more data for analysis so that the effectiveness of the fan can be judged – one sensor at sofa height, one at ceiling height, one close to the stove, etc.

UPDATE JAN 2014 – We have now published our detailed article: Valiant PremiAIR 4 Heat Powered Stove Fan Testing on the REUK website. In the end, rather than building another SD Card Datalogger for this project, we used a Raspberry Pi Model A+. We will be publishing a detailed article in the coming months on how we programmed and set up this datalogger (including the source code), and also how viewed the data in real time through a mobile phone browser.

Low Voltage Disconnect with LCD Display

Pictured below is our latest low voltage disconnect circuit with LCD display.

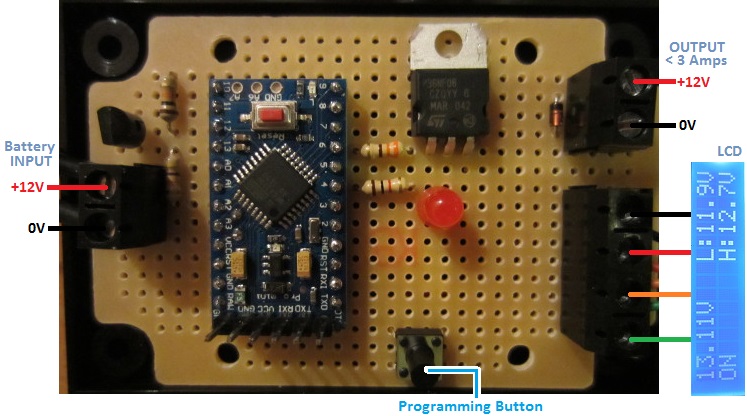
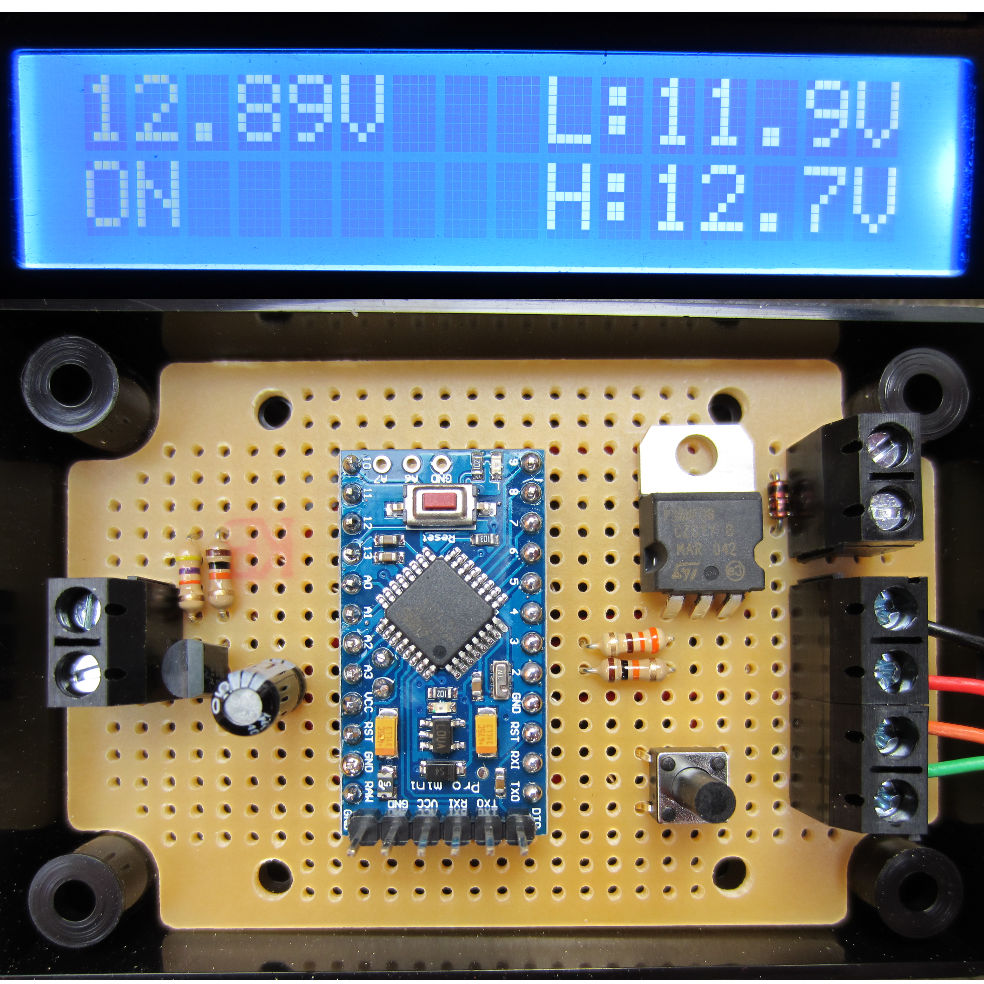
REUK low voltage disconnect with LCD displayAs with our standard programmable low voltage disconnect (LVD), this device is designed to protect batteries from being discharged too deeply and permanently damaged. The user can set the low voltage at which the output loads will automatically be switched off, and also the higher cancellation voltage above which the output loads will be switched back on again.

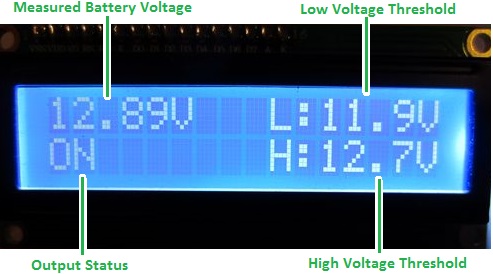
LCD display on REUK low voltage disconnect (LVD)This particular LVD has a backlit LCD on which system information is constantly displayed. It is also used when setting the low and high voltage thresholds which makes things  a lot clearer and simpler than using LEDs or a rotary switch to programme those in.

As shown above the display shows the measured battery voltage updated multiple times per second and given to 2 decimal places of resolution (and calibrated to be accurate to within +/- 0.02 Volts across the range 10-16V).

The system status is usually ON or OFF, but can also be LOW or HIGH when the battery voltage is transitioning one of the thresholds about to change the state of the system. The high and low threshold voltages are also permanently displayed.

In order to avoid the output cycling on and off too often (particuarly as the battery voltages can spike or dip depending on the loads they are powering) there is a time delay during which the voltage must remain under/over the voltage threshold before the system will change from ON to OFF or OFF to ON respectively. During that time delay the backlight of the display flashes as a visual indicator that the threshold has been breached. We chose to flash the display itself rather than flashing an LED either on the board or on leads, since it is much easier to panel mount just the LCD than to mount both that and an LED indicator.

This particular client-tailored LVD has a MOSFET directly switching the output loads which can have a maximum total rating of 3 Amps. We can also make this with a relay fitted on board for direct switching, or a lower rated output which can be used to energise a high current (or high voltage) rated relay external to the board – e.g. an automotive relay or a solid state relay (SSR).

This low voltage voltage disconnect with LCD is now available direct from the REUK Shop. Click here to find out more or to purchase now: buy REUK Low Voltage Disconnect with LCD.

We will shortly be adding a very similar unit with the addition of datalogging functionality. Over the last couple of years we have sold many LVDs with built in dataloggers (see here for an example: Low Voltage Disconnect with Display and Datalogger), and we now have refined things to the point that the product is ready for general sale. In the meantime, if you have any requirement for a low voltage disconnect with or without a display and with or without datalogging, please email neil@reuk.co.uk with details of your requirements.

Arduino Datalogger Testing

We recently built and tested a very simple SD card datalogger based around an Arduino Pro Mini – the smallest and cheapest Arduino board commonly commercially available. We have previously described datalogging to an SD card with an Arduino in our blog post Arduino SD Card Datalogging (to log temperatures). In this example we are instead logging the voltage of a solar charged battery used to power the lights in a shed.

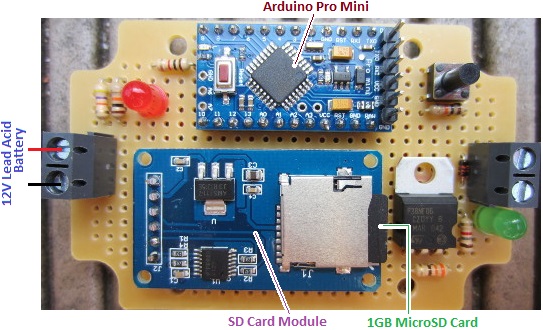
REUK Arduino Battery Voltage Datalogger

The Arduino Pro Mini (£3) was programmed from a PC via an FTDI breakout board (£5), and connected to an Arduino micro SD module (£1) fitted with a 1GB micro SD card (£3).  Note that the unlabelled components in the image above are not required for this datalogger – we just built the controller so that it can later also be used as a low voltage disconnect.

We programmed the Arduino to read in the voltage of a 5Ah 12V SLA (via a 47K-10K voltage divider) and write it to a log file on the SD card once every second. The battery is connected to an 80 Watt PV solar panel via a solar charge controller. The battery is also connected to  three 1W LED spotlight bulbs which were left permanently on so that the battery would drain over night and be recharged during the day.

The datalogger was left connected to the battery from around 10:30am one day to around noon the following day in mid-April with blue skies both days.

USB memory card reader

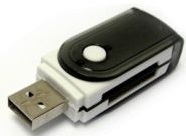
In order to view the data collected on the micro SD card we just needed a USB all-in-one memory card reader (£1). Plug the micro SD card into the reader, plug the reader into a PC via USB, and download the collected data.

The collected data file (which was simply a list of voltages measured to 2 decimal places) was 97070 lines long with a file size of 680 kB. Therefore our 1GB card could have logged the battery voltage once a second for 3-4 years.

Looking through the datalog in a text editor it was obvious that the battery voltage did not change very fast at all. Therefore logging the voltage every second was unnecessary for this application – every 30 seconds or every 60 seconds would have been adequate.

Knowing from experience that plotting 100,000+ data points with Excel is usually an unhappy experience, I first copied the log file over to my Raspberry Pi, and ran the following sed script to create a new smaller file containing just every 60th record from the log file. (This is equivalent to having set up the datalogger to log the voltage once per minute in the first place.)

sed -n '0~60p' logfile.txt > 60slogfile.txt

This command took just 0.24 seconds on the Raspberry Pi (thanks to the raw speed of sed) and I then dropped the new smaller (1617 records) log file into Excel and made the following plot of the results.

Datalogger data collected from solar powered shed lighting

The vertical axis shows the measured voltage, and the horizontal axis shows time with the far left being 10:30am on day1 and the far right being noon on day2.

The plot shows how the solar charge controller carries out a bulk charge phase to rapidly charge the battery (peaking at 14.6V) and then maintains a float charge (around 13.6V) during the day while the solar generation far exceeded the charge used by the spotlights. At night the voltage of the battery drops rapidly down hitting a low of 11.95V before the sun rose high enough to start to charge the battery again.

If you need a voltage datalogger like this, a voltage datalogger with a built in low voltage disconnect to protect the battery from being too deeply discharged, or any other kind of single or multi-channel datalogger, please email neil@reuk.co.uk with details of your exact requirements.

Dawn Dusk Automatic Hen House Door Controller

Pictured below is a hen house door controller which will automatically open the hen house door in the morning and close it again at night to protect the birds from foxes and other predators.

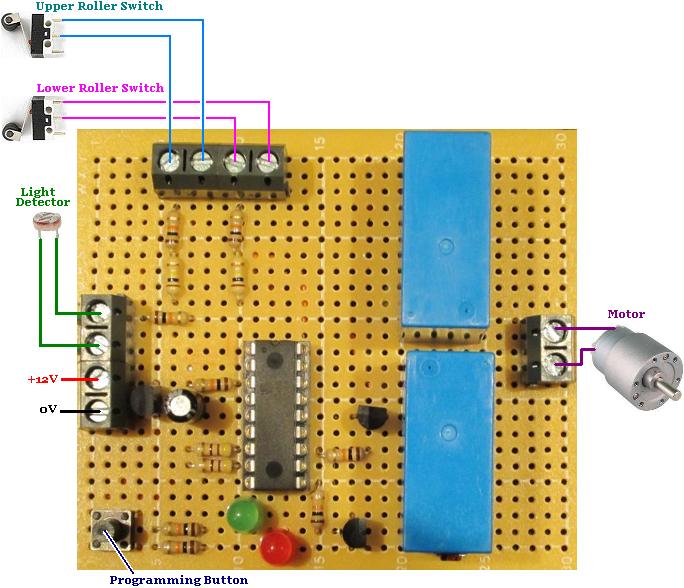
Automatic hen house door controller with dawn dusk light detector and limit switchesThis controller is somewhat based around our Simple Hen House Door Controller which uses a low voltage programmable digital timer to set when the door should open and close.

This version instead takes an input from a light detector (click here for our article introducing Light Dependent Resistors), and uses this to detect dawn and dusk.

When dusk begins, the motor turns one way to lower the door until it presses against and closes the lower roller switch which acts as a limit switch. Similarly, when dawn begins the following morning, the motor turns the other way to raise the door until it closes the upper roller switch.

(For the explanation of how the polarity of the voltage sent to the motor is reversed see our introductory article: Automatic Hen House Door Controller).

In order for the user to set the light level threshold at which day becomes night and night becomes day, a programming button is provided on the circuit board. When the ambient light level is at the level considered by the user to be the threshold, they press this button while powering on the controller to save that measured light level as the new threshold. The threshold is stored in permanent memory and is therefore not lost even when the controller is subsequently disconnected from the power.

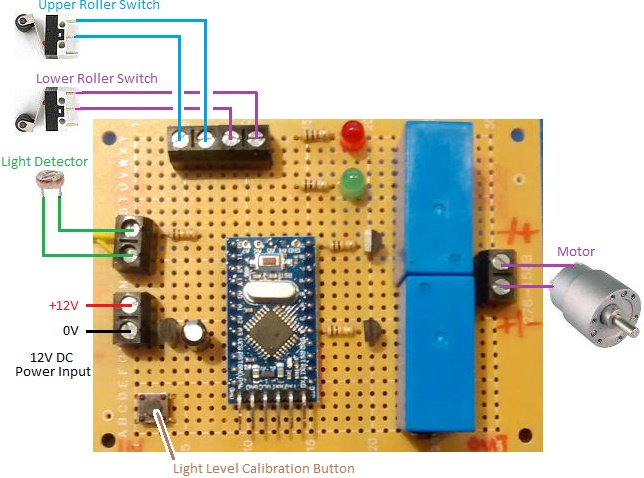
connection diagram for Arduino based dawn dusk hen house door openerPictured above is a functionally identical controller, but which is built around an Arduino Pro Mini instead of the PICAXE-18M2 used in the original. The instructions for this controller are available here: Dawn Dusk Henhouse Door Controller Instructions.

If you need any type of door controller contact neil@reuk.co.uk with details of your exact requirements.

Arduino SD Card Datalogging

We recently published our Arduino Solar Water Heating Pump Controller Design and Code which shows the basics of putting together a very simple solar water heating pump controller which you can then extend to add the other features you require. (Click here also for our Introduction to Arduino.)

The feature about which we have received the most questions is datalogging functionality to generate a log file of the temperatures recorded and the status of the pump (on or off).

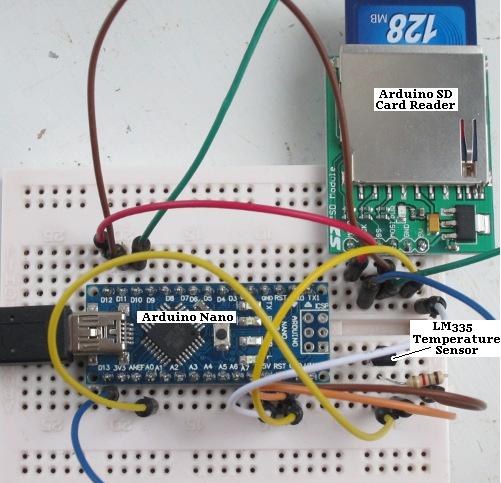
Arduino SD card temperature datalogger

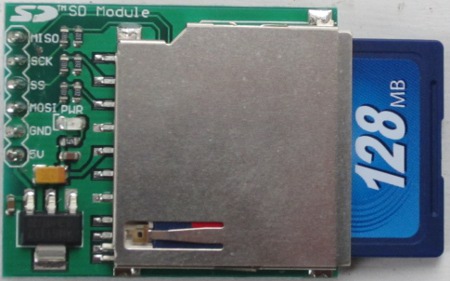
Pictured above is a demonstration on prototyping breadboard of how datalogging can be achieved using an Arduino SD Card Module (click link to buy). These are available from just £0.99 including delivery for standard SD cards (and from around £1.60 including delivery for modules for micro SD cards).

Arduino SD card reader moduleSD card modules for Arduino are very simple to use. SD cards operate on 3.3V, but the Arduino on 5V; however, these modules have all the necessary components fitted to bring down the voltages and enable safe reliable operation without the need for you to add any external components.

In the breadboard demonstration above, we have a single LM335 temperature sensor connected to the A0 pin of an Arduino Nano as per the solar water heating pump controller design (linked to at the start of this post).

We then have the following connections between the Arduino and the SD Card module:
Arduino D10 to SS (slave select)
Arduino D11 to MOSI (master out slave in)
Arduino D12 to MISO (master in slave out)
Arduino D13 to SCK (serial clock)
We also connected the 5V and GND pins of the Arduino to the corresponding SD Card module connections to power it.

Note that some SD Card modules have their connections labelled differently.
CS=SS, DI=MOSI, DO=MISO, and CLK=SCK.

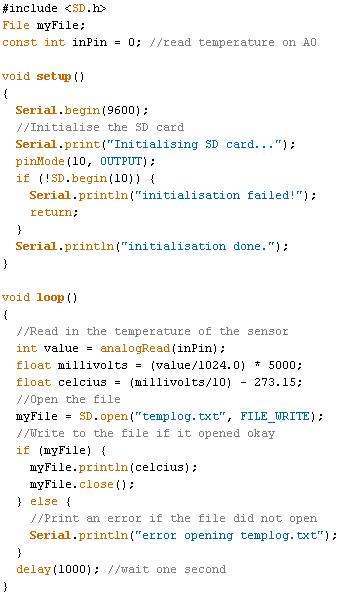
For this demonstration we just want to create a text file (called templog.txt), measure the temperature once per second, and add each temperature reading to the end of the file to form a very basic datalog.

Arduino temperature datalogger sd cardThe stored data on the SD card can then be viewed, manipulated, and graphed on a PC. Multiple temperature sensors (or other sensor inputs) can be added and logged by extending the bare bones Arduino code above.

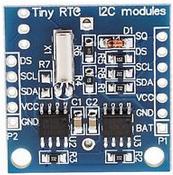
arduino rtc real time clock module

For a more advanced datalogger, the next key element to add is an RTC (real time clock). Using an RTC each data point can be logged alongside the exact time that it was recorded. Arduino RTC modules including a backup rechargeable button cell are available very cheaply. We will show you how add an RTC to an Arduino datalogger in a future post.

PICAXE Arithmetic Problems

Hitting the maximum number limit with PICAXE microcontrollers

In a recent post we showed our 24V Low Voltage Disconnect with Data Display. This device monitors and logs the voltage of a 24V battery bank, disconnects the output loads if that voltage is too low to protect the batteries, and has an LCD display on which the last 100 days of battery voltages can be checked, summarised, and the maximum and minimum recorded voltages displayed for analysis.

This device is built around a PICAXE microcontroller. These are simple to use and quick to programme microcontrollers, but they have a few ‘features’ which can make life difficult (sometimes making an Arduino a far better alternative). PICAXE chips can only process numbers in the range 0-65535, they cannot process negative numbers, and cannot process floating point (decimal) numbers.

In most cases those limitations are not an issue, but with our 24V LVD for example it was. The microcontroller is powered via a 5V regulator. In order to measure incoming voltages over 5V, a voltage divider (Wikipedia) is required – a pair of resistors connected in series with one end connected to the incoming voltage to be measured and the other end to 0V. The values of the resistors are chosen so that the voltage measured where the two resistors meet is in the range 0-5V across the full range of likely input voltages.

For our standard 12V low voltage disconnects we use a 47K resistor for R1 and a 10K for R2. The voltage output from this voltage divider is equal to R2/(R1+R2) multiplied by in the input voltage. So, if the input voltage is 13.00V for example, the voltage divider output voltage will be 13*(10K/(10K+47K))=2.281V which the 10-bit ADC on the PICAXE will see as (2.281V/5V)*1023=467. Only when the input voltage exceeds 28.5V will the voltage from this voltage divider exceed 5V, and 28.5V is never going to be seen from a 12V battery.

With our 24V datalogging LVD we chose 68K for R1 and 10K for R2. This gave an input voltage range of 0-39V corresponding to the ADC range of 0-1023 which is perfect for a 24V battery system. However, we hit upon a problem.

We work out what an input voltage of 1V corresponds to as an ADC value after passing through the voltage divider. With the 68K/10K divider on our 24V LVD, 1V on the input corresponds to an output of 0.12821V which corresponds to (0.12821/5)*1023=26.23. Therefore, if we divide the ADC value on the microcontroller by 26.23, we calculate the input voltage.

BUT, the PICAXE chip can only do integer arithmetic. An ADC value of 415 in this example corresponds to a measured input voltage of 415/26.23=15.8216V, but with integer arithmetic 417/26=15V so off by almost a full Volt.

In order to retain resolution and accuracy while forced to use integer arithmetic, we multiply the ADC reading by 100 and divide it by ten times the per volt ADC value. The result given is ten times the input voltage – for example (415*100)/262=158 which means 15.8V which is close enough to the actual value.

But, this approach can then lead to another problem. In the case of our 24V LVD with the 68K/10K voltage divider, when the input voltage exceeds just below 25V (which will almost always be the case with a maintained 24V battery bank), the ADC value is greater than 656. When we multiply this ADC value by 100 we get a number of over 65600 which the PICAXE (with its maximum number limit of 65535) cannot process. For example it will see 65536 as 0, 65537 as 1, 65538 as 2, and so on and will think that an input voltage of 25V is less than 1V which is not much use.

There are many (very complicated) ways around this maximum number problem using variables and/or the EEPROM to store parts of large numbers while doing calculations, but in the case of the 24V LVD with datalogger, all the internal data EEPROM was dedicated to datalogging, and all the variables were already being used. Therefore, instead of multiplying the ADC value by 100 and dividing it by ten times the per Volt ADC value, we modified our code to multiply the ADC value by 50 and divide it by five times the per Volt ADC value. This results in a small loss of accuracy of less than 0.1V at the upper range of predicted voltages, but works well enough for this particular device.

So, when choosing a voltage divider for an accurate voltage measuring device with a PICAXE chip, choose the resistors to ensure that the full possible input voltage range is more than covered, and also that any multiplication of ADC values in order to maintain resolution with integer arithmetic does not generate numbers over 65535. (Alternatively just use an Arduino with floating point arithmetic!)

GertDuino has Arrived

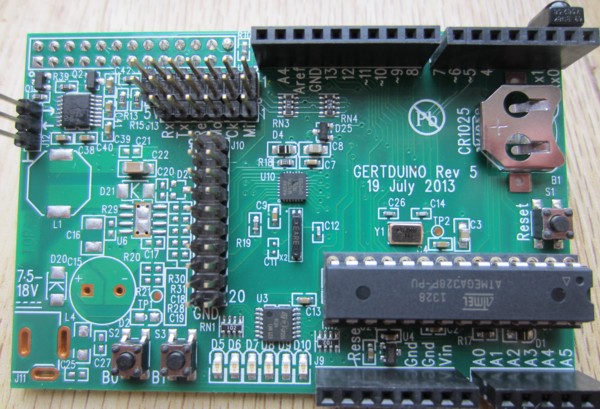
Today our GertDuino board arrived. Here are a couple of photographs of GertDuino. First of all the whole board.gertduino raspberry pi board

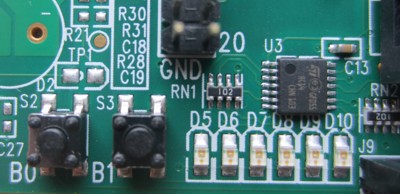
and then a zoomed in image of the user buttons B0 and B1 and LEDs D5-D10 which should prove to be very useful when making prototypes as they can be used to show system status and to accept user inputs without the need for any external components.

gertduino leds and buttons

We have some projects in the pipeline for which the GertDuino / Raspberry Pi combination will be perfect, so we will have some detailed articles on GertDuino very soon on the main REUK.co.uk website.