Here is our detailed review of the low-cost RC-51T USB temperature data logger.
Here is our detailed review of the low-cost RC-51T USB temperature data logger.
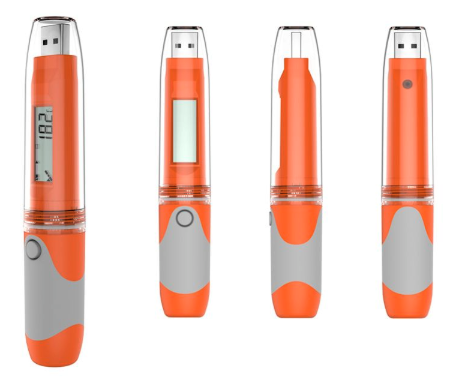
Pictured above is a high accuracy (within 0.1°C) low power temperature data logger designed originally for scientific research in sea turtle egg incubation, but which could be put to use in a great many other applications.
This logger measures and logs the temperature once every 10 minutes exactly with sufficient memory space to hold 180 days of data (26,000 records). The logger is powered by a CR2032 coin cell battery which can keep it running unattended for the full 180 days.
When the measurement period is over, the logger can be extracted from its waterproof case and the logged data transmitted over a UART connection via a cable to a PC for subsequent analysis.
The goal of this project was to achieve all of the above at a cost per unit (of a batch of 50 units) of under €5, including the case.
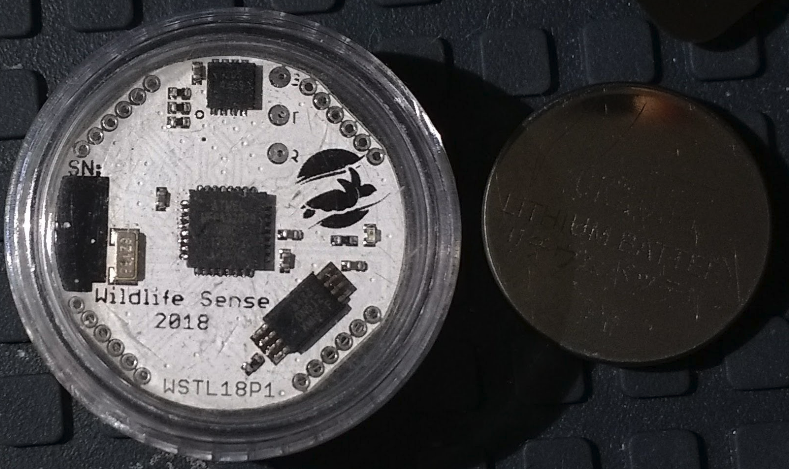
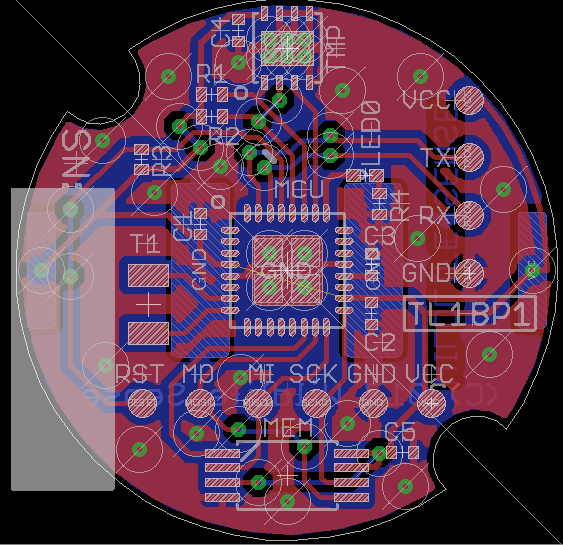 The temperature sensor used is a 16-bit resolution digital MAX30205MTA+. This gives a temperature resolution of 0.00390625°C and 0.1°C accuracy in the range 0-50°C. The microcontroller chosen is the ATMEGA328PB – a slightly more feature rich version of the MCU found on many Arduino boards. The serial flash memory chip used is a 512kbit AT25DN512C from Adesto which has sufficient space to hold the 410-420kbit of data to be logged in six months.
For full details, plans, and discussion of this project, click here: Low Power Cost and Size Temperature Data Logger.
Pictured below is a device we were recently commissioned to design and build.
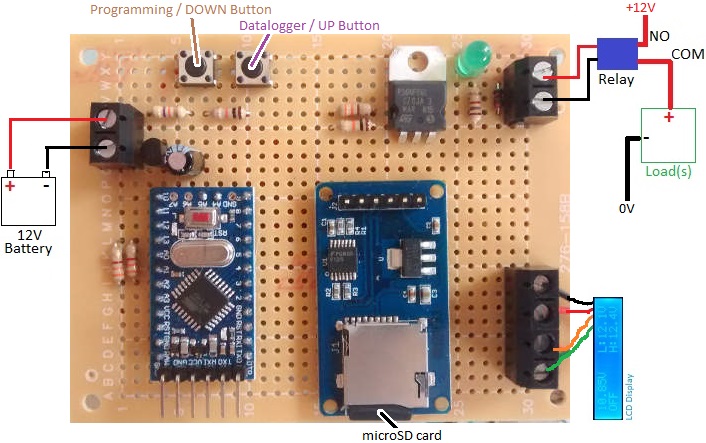
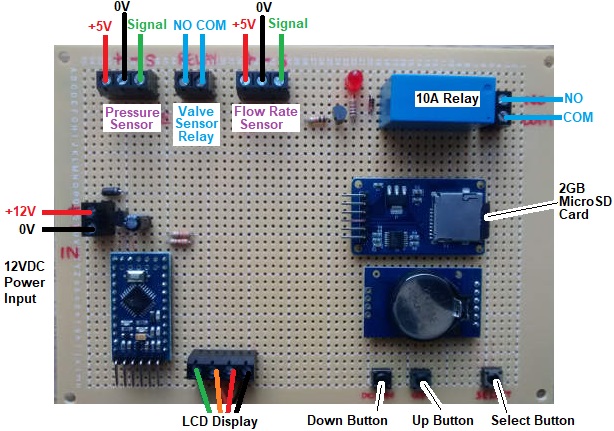 This device, built around an Arduino Pro Mini, is one of the most complex projects we have completed recently. It is primarily a timer (utilising a ds3231 real time clock (RTC)) to energise a relay for a user programmed number of minutes once every day, week, fortnight, or month. However it must also monitor and process data from three sensors and log these readings to a micro SD card for later analysis at intervals which depend on the status of the system at any one time.
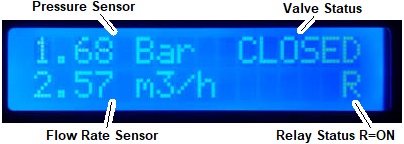
This device has a display to show the user the status of the system with readings from a pressure and a flow rate sensor as well as a valve and a relay which the device controls.
Detailed datalogging is only required when the valve is open (with logs appended at a rate of once per second), but the pressure sensor status must be logged every hour and changes to the status of the valve and other significant system changes must also be logged as and when they occur.
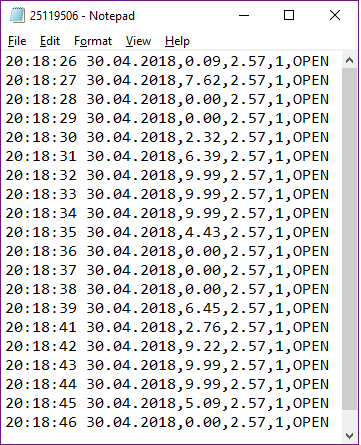
When logging data every second, it does not take long to generate a file which is unwieldy to process in Excel or other programmes. Therefore, our device creates a new file each time the valve opens, and logs to it until the valve closes again. In this way, there is one reasonably sized datalog file for each valve opening event together with one master log file which is appended hourly and also when there is a significant change detected in the system.
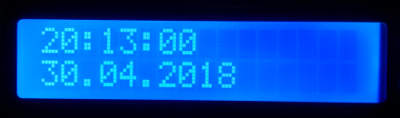
Having mulitple datalog files not always recording data at regular intervals, it was essential that the timestamp for each line record in the logs showed the actual time and date rather than just an index value.
 This will make future analysis of the collected data much easier.
The user is able to set the number of minutes that the relay is ‘on’ and also the precise time of day at which they would like the relay to turn ‘on’. The interval between relay ‘on’ events for this particular device was set to daily, weekly (7 days), fortnightly (14 days), or monthly (28 days).
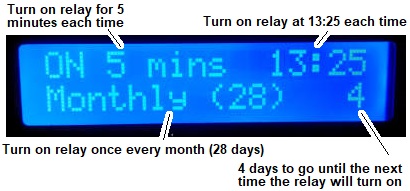 An added feature is that the user can manually change the number of days until the relay will next turn ‘on’ which is particularly useful for testing the system or forcing the relay to turn ‘on’ at a previously unscheduled time and date if required.
The last piece of complexity was the flow rate sensor. This sensor outputs high pulses at a per second rate which when multiplied by 0.2 gives the litres per minute rate of flow through the sensor. The results generated then had to be converted into the desired cubic metres of flow per hour to be displayed and logged. As we did not have access to this flow rate sensor, we had to use a second Arduino to simulate the square wave the sensor generates to fully test the device we built. With a maximum of 1000 pulses per second to detect (for the maximum expected 12m3 per hour flow rate), the 16MHz clock of the Arduino Pro Mini was more than up to the job of simulating the sensor.
If you need any kind of timer or multi-channel datalogger, please email neil@reuk.co.uk with details of your requirements.
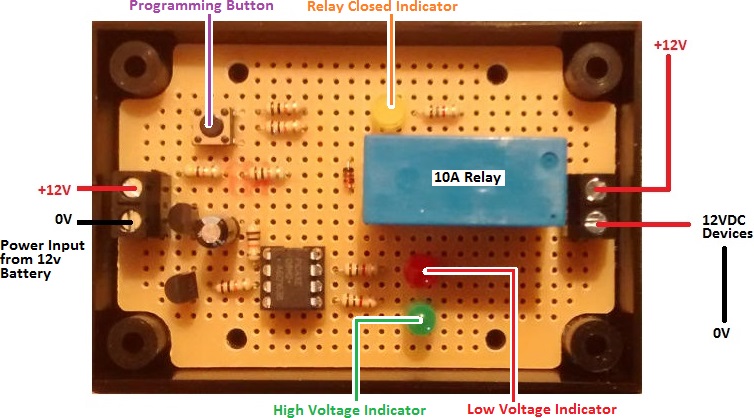
 Pictured above is a low voltage disconnect device which we recently made for a client. It offers all of the battery monitoring, protecting, and datalogging functions and features of our REUK Programmable Low Voltage Disconnect with Display and Datalogger, but with the added benefit of an on board microSD card to store the measured battery voltage once per minute.
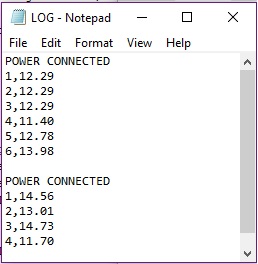
The voltage data is written to a simple text file on the SD card. When the battery is connected to the low voltage disconnect and powers it, POWER CONNECTED is written to the log file. Then each subsequent minute, the battery voltage is written to the file preceded by the number of minutes since the power was last connected. For example the line 6,13.98 indicates that 6 minutes after the power was connected, the battery voltage was measured to be 13.98V.
While the pre-existing basic datalogging of the LVD is useful for constantly displaying the minimum, maximum, and average measured voltages, every now and then it is good to have the option to copy the data from the SD card to a PC for more detailed analysis and plotting etc.
If you need any kind of datalogger, please email neil@reuk.co.uk with details of your requirements.
Pictured below is a special low voltage disconnect (LVD) device which we have been supplying for a few years for use by academic researchers in glaciology.
Solar charged batteries are being used to power GPS dataloggers on glaciers in Greenland. These GPS devices accurately record the movement of glaciers, and this (velocity) data can be used in a wide range of polar and climate change research.
The specific set up for which these LVD devices were designed has a 48 Watt PV solar panel charging a 60-100Ah 12V battery via a Sunguard solar charge controller.
In high polar regions, in the summer, the sun is in the sky 24 hours day, but in the winter is is below the horizon 24 hours per day. Therefore, during the winter months the battery cannot be charged. For the battery to still be usable in the spring it must retain some charge, so the GPS has to be disconnected before it overly discharges the battery.
The GPS modules have their own built in low voltage disconnect circuitry, but a step-up voltage regulator is fitted between the 12V battery and the GPS modules (which need 15+V to operate), so the GPS sees a steady consistent good voltage right up until the 12V battery is virtually dead.
In our standard low voltage disconnects, the output is turned off when the battery voltage falls and remains below a user set low voltage for 10 seconds. The output turns back on when the battery voltage reaches and remains above a user set cancellation voltage for 10 seconds.
For a solar powered system and often very limited daylight hours, this can see the output being turned on and off multiple times per day. This is not a problem for an LVD used with lighting for example, but the GPS modules used for this project create a new datalog file each time the power to the module is connected, and there is a 512 file limit. If over the course of the many months that the GPS module remains on the glacier unattended, the power to it is cut and restored more than 512 times, data will be lost which is not acceptable.
In order to prevent this problem, our low voltage disconnect engages as usual after 10 seconds of low voltage being measured ensuring that power to the GPS is rapidly cut if the voltage is low, but then the voltage has to remain consistently over the cancellation voltage for one hour before the power to the GPS module is restored. Doing this ensures that the GPS is only powered up when the battery is known to hold enough charge to make it worthwhile taking up one of the 512 available file spaces.
If you need any kind of special low voltage disconnect or voltage monitoring device, email neil@reuk.co.uk with details of your requirements.
Pictured below is a five channel thermometer which is destined to be used as a part of a ground source heat pump heated underfloor heating system in Cyprus.
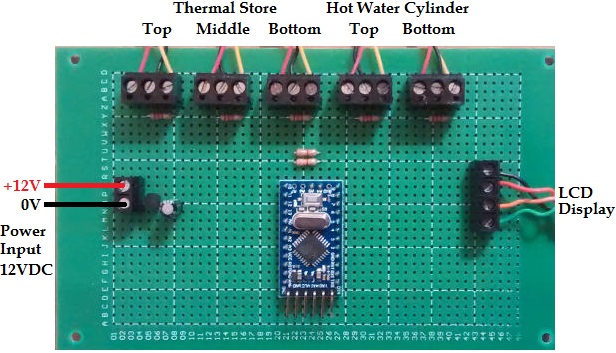
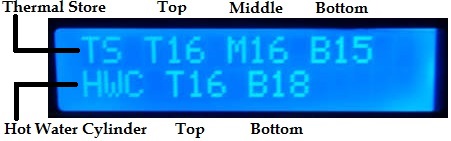
This system has an 11kw ground source heat pump with a 160 litre hot water cylinder (HWC). Soon 4 square metres of solar thermal panels will be added to heat a 300 litre thermal store (TS). The whole system has been put together by an experienced plumber using tapstats to control the flow of heated water depending on its temperature – no electronic controllers at all. He did however have the need for a way to easily monitor the temperature of the water in the two large vessels.
The two vessels have been made with pockets in them for temperature sensors – two for the hot water cylinder (one at the top and one at the bottom), and three for the thermal store (for sensors at the top, middle, and bottom).
We used our usual waterproof DS18B20 temperature sensors for this thermometer as they have proven to be accurate and very reliable.
If you need any kind of digital thermometer, thermostat, or data monitoring / datalogging device, email neil@reuk.co.uk with details of your requirements.
Our 2016 Solar Water Heating Pump Controller is one of our most popular products. Pictured below is a derivative recently requested by one of our clients.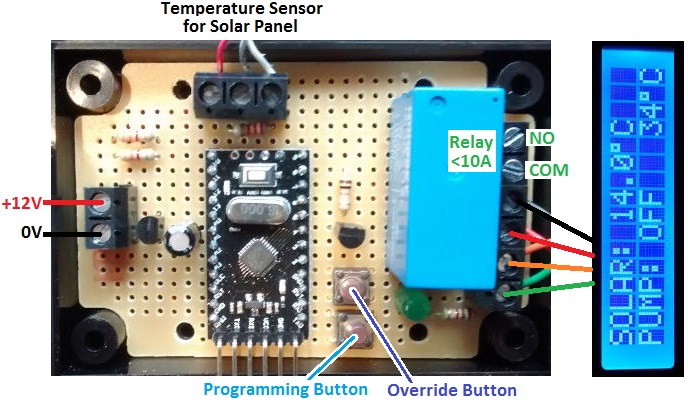 This controller will be used to control the operation of a pump circulating water through a solar thermal panel. Our standard controllers have at least two sensors – one for the pool/tank and one for the solar panel – but for this particular project only one sensor could be used: at the solar panel.
Therefore, instead of using the temperature differential between the solar panel and the pool to decide when the pump should be turned on or off, the user sets a high temperature threshold above which the pump will turn on, and a low temperature threshold below which it will subsequently turn off.
Sensible starter values would be 70 degrees C at the panel to turn on the pump, and around below 35-40 degrees at the panel to turn off the pump. With experimentation and analysis (this device has a built in datalogger) it will be possible to refine these thresholds to maximise efficiency. The pump should not be turning on and off too frequently and running for very short times, but the panel should also not be left at very high temperatures for a long time or it will radiate heat away before it can be transferred to the water.
If this device was to be used in a small pool or hot tub, and if the arriving hot water from the panel is pumped straight in without pre-mixing, a lower pump turn on temperature would be essential so that no-one gets burned on the incoming hot water.
If you need any kind of pump controller, email neil@reuk.co.uk with details of your specific requirements.
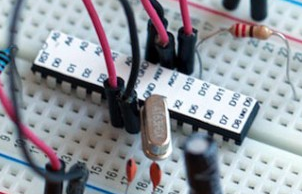
In general when using an Arduino Pro Mini in one of our projects or products, we use an external LP2940CZ-5.0 voltage regulator instead of the on board regulator. This is because most things we make are for 12V battery systems, and the voltage from a 12V battery can get to well over 12V which is the specified upper input voltage for a Pro Mini. We have measured that one of these regulators with a 10uF capacitor across its 5.0V output, draws a quiescent current of only 0.079mA.
We have found that an Arduino Pro Mini, whether powered as described above, or with the on board regulator draws around 20mA @ 12.0V. This is very high for an always on battery powered device – it will use 500mAh (0.5Ah) of battery charge per day. Therefore, we are always interested in testing ways to minimise power consumption.
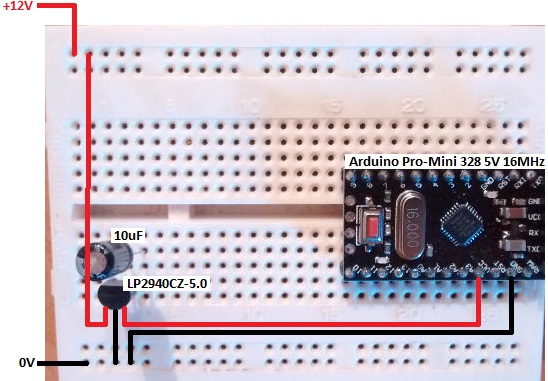
We set up the above test circuit with a 12V input, and our usual LM2940CT-5.0 regulator connected to an Arduino Pro Mini (16MHz / 5V). With a sketch containing just delay(8000); in the loop() function – i.e. the Arduino will wait 8 seconds, then wait another 8 seconds, then wait another 8 seconds, etc – we measured a current draw of 19.793mA @ 12.0V input voltage.
We downloaded and installed the following Lightweight low power library for Arduino – LowPower.h, and modified our test sketch as shown below to power down the microcontroller for 8 seconds within the loop.
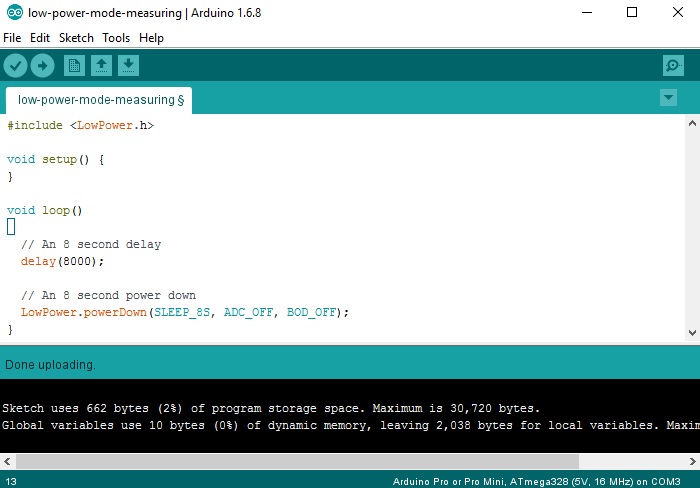
This time we measured the current draw to be just 6.265mA @ 12.0V input voltage – a huge reduction of around 70% power consumption obtainable just by replacing the delay function with the powerDown function from the LowPower library.
We make a lot of dataloggers and monitoring devices which spend most of their time doing nothing – just waiting to take the next measurement. Therefore this low power library is a quick and easy way to reduce power consumption.
(Note that 8 seconds is the maximum power down duration that can be set with this library, but by using loops of multiple 8 second intervals in your sketches, you can create a low power consumption delay of as long as you want.)
 If you use a Standalone Arduino on a breadboard directly powered by a battery pack of the correct voltage (i.e. no voltage regulation required), it is possible to run your Arduino off less than 50uA @5V (<1000th the power consumption of our tests above) and therefore power something for years with a AA cells or smaller. See here for an excellent article How to Run An Arduino For Years on a Battery from the Open Home Automation website where they use the JeeLib low power library with a standalone Arduino.
Pictured below is a controller we recently made for a solar water heating system including a full datalogger.
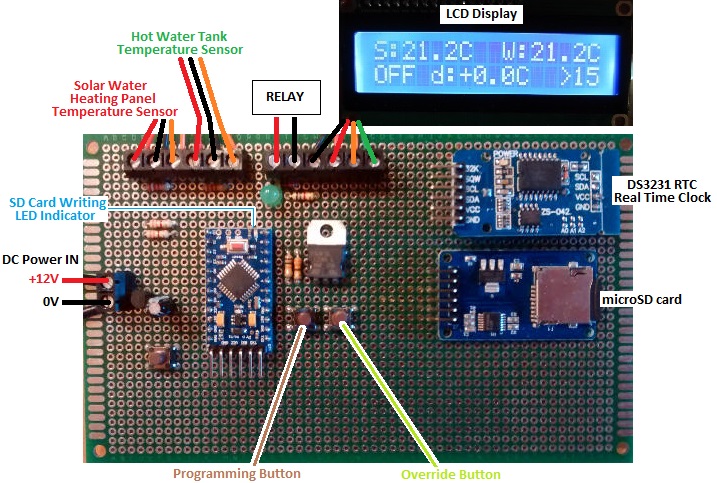
This controller is based closely around our 2016 Solar Water Heating Pump Controller which already has basic datalogging functionality – minimum, maximum, and average temperature sensor readings displayed on the LCD.
To this we have added a micro SD card reader and a high accuracy DS3231 Real Time Clock (RTC). Every 15 seconds, the temperature of each of the sensors, the status of the controller, and the date and time are appended to a logging text file on the micro SD card.
 The collected data can then be copied over from the SD card to a computer for detailed analysis, graph plotting, and so on.
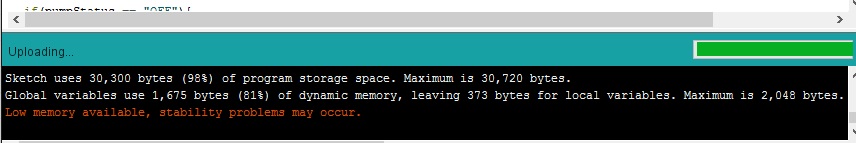
This controller is based around an Arduino Pro Mini coupled with an LCD module, DS3231 RTC module, micro SD card module, and DS18B20 temperature sensors – all of which are readily available and economically priced. The only difficulties with this project came from the limitations of having only 32KB of flash memory (program space) on the Arduino Pro Mini – not a lot when including so many code libraries for the various modules and sensors as well as 750 lines of of project specific code for this complex datalogging controller.
If you need any kind of datalogger, please email neil@reuk.co.uk with details of your exact requirements.
We are often asked how to log data from an Arduino to a text file saved on a Windows PC. This is very simple with Linux and Mac OS, but it can be also be achieved on Windows with minimal effort.
We make a lot of dataloggers, the majority of which either store data internally and then output a summary to an LCD display, or dump all collected data to an SD card for later processing and analysis on a PC. However, it is relatively simple to collect data from any number of sensors connected to an Arduino board and send that data over a serial connection directly to a text file on a PC.
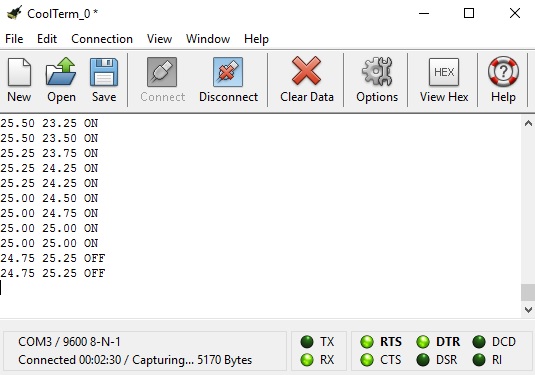
There are many software options available, but we typically use CoolTerm (available free of charge here: download CoolTerm) which is a serial monitor which will also capture transmitted data to a text file and automatically add time stamps to each line of data which are essential for a good datalogger.
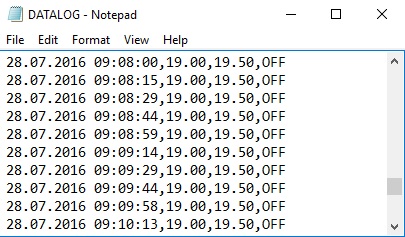
As an example we slightly modified the code for our 2016 solar water heating pump controller so that every time data is taken from the two connected digital temperature sensors, those measurements and also the system status (pump ON or OFF) are output through the serial port to a connected PC. (Full details on generating Serial output from an Arduino are available here: Arduino Serial from the official Arduino Reference site.)
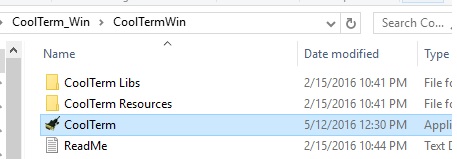
Download CoolTerm from the link already provided above. You will end up with an approximately 10MB zip file which needs to be extracted. When that is done, go into the folder created, and double click on the CoolTerm application.
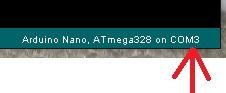
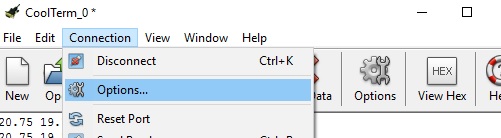
 Click on Connection > Options and then in Serial Port Options select the Port you would like to use. If you are using the Arduino IDE, in the bottom right hand corner of the window will be shown the type of board you are using followed by COM# where # is the number of the port your Arduino is currently set up to use and is also the port you should select within CoolTerm).
 At the same time set the baudrate to 9600 (making sure that in the sketch you have uploaded to your Arduino, you have also included Serial.begin(9600); in the setup() function.
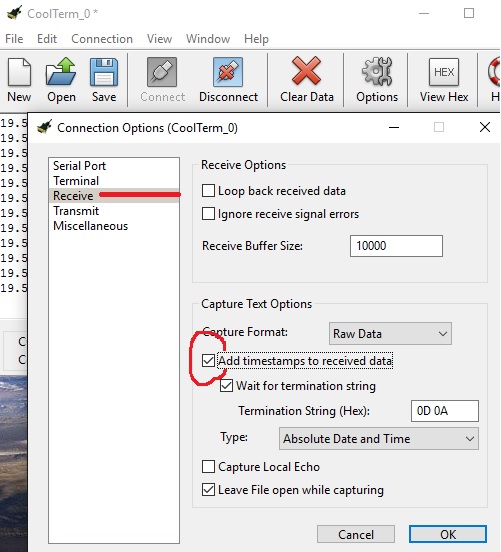
Assuming that you would like all data to be timestamped (adding the date and time to every line of data sent), do Connection > Options > Receive and check the ‘Add timestamps to received data’ box.
Then to have any serial data from your Arduino automatically stored in a text file on the PC, do Connection > Capture to Text File and then click on Start. You then just have to set the name for the file that you would like your data to be stored in, and your datalogger is complete.
To stop collecting data, you can either click on the large Disconnect icon, or if you want to stay connected to the Arduino board, do Connection > Capture to Text File > Stop.
Once you have either disconnected the Arduino board or Stopped the capture, you cannot then restart and append data to the same file – you can only overwrite the original file or start a new one. If you want to pause capture and then restart it to append to the same file, do Connection > Capture to Text File > Pause to pause, and then Connection > Capture to Text File > Resume to resume it at a later time.
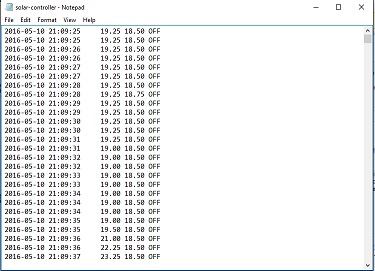
When you have finished capturing data, you will end up with a text file of everything captured which can be processed and visualised using Excel or a similar application.